👋🏻 Hi, I'm Michelle
I helped increase abandoned cart recovery by up to 13%, reduced sales bottlenecks by decreasing merchant account creation time from 70+ days to minutes, and streamlined business expense reconciliation, eliminating weeks of manual work from financial workflows.
12+ years experience
Designing across companies like Bolt, Capital One, and C.H. Robinson, from startup to enterprise, across B2B, B2B2C, and SaaS products.
E-commerce, Fintech, & Logistics
Deep domain expertise in high-stakes industries where design directly impacts revenue and operations.
Designing & building with AI
Shipping real products with the use of LLMs (Claude, Gemini, Llama) and agentic workflows, from prototype to deployed app.
How I work
I bring a mix of strategic thinking, systems design, and hands-on building to every project.
Product strategy & problem framing
I partner closely with product and engineering to identify high-impact opportunities and translate complex problems into clear product direction. My work focuses on connecting user needs, business goals, and technical realities to drive meaningful outcomes.
Designing for complex systems
I specialize in simplifying complex platforms, from financial infrastructure to multi-surface product ecosystems. I think in systems, ensuring solutions scale across workflows, teams, and evolving product architectures.
Designing & building with AI
I design and ship real products with AI, using agentic workflows and LLMs like Claude, Gemini, and Llama to take ideas from concept to deployed app in days. That hands-on work means I understand the novel design problems AI introduces: building trust in systems that are sometimes wrong, and surfacing just enough of the model's reasoning without overwhelming the user.
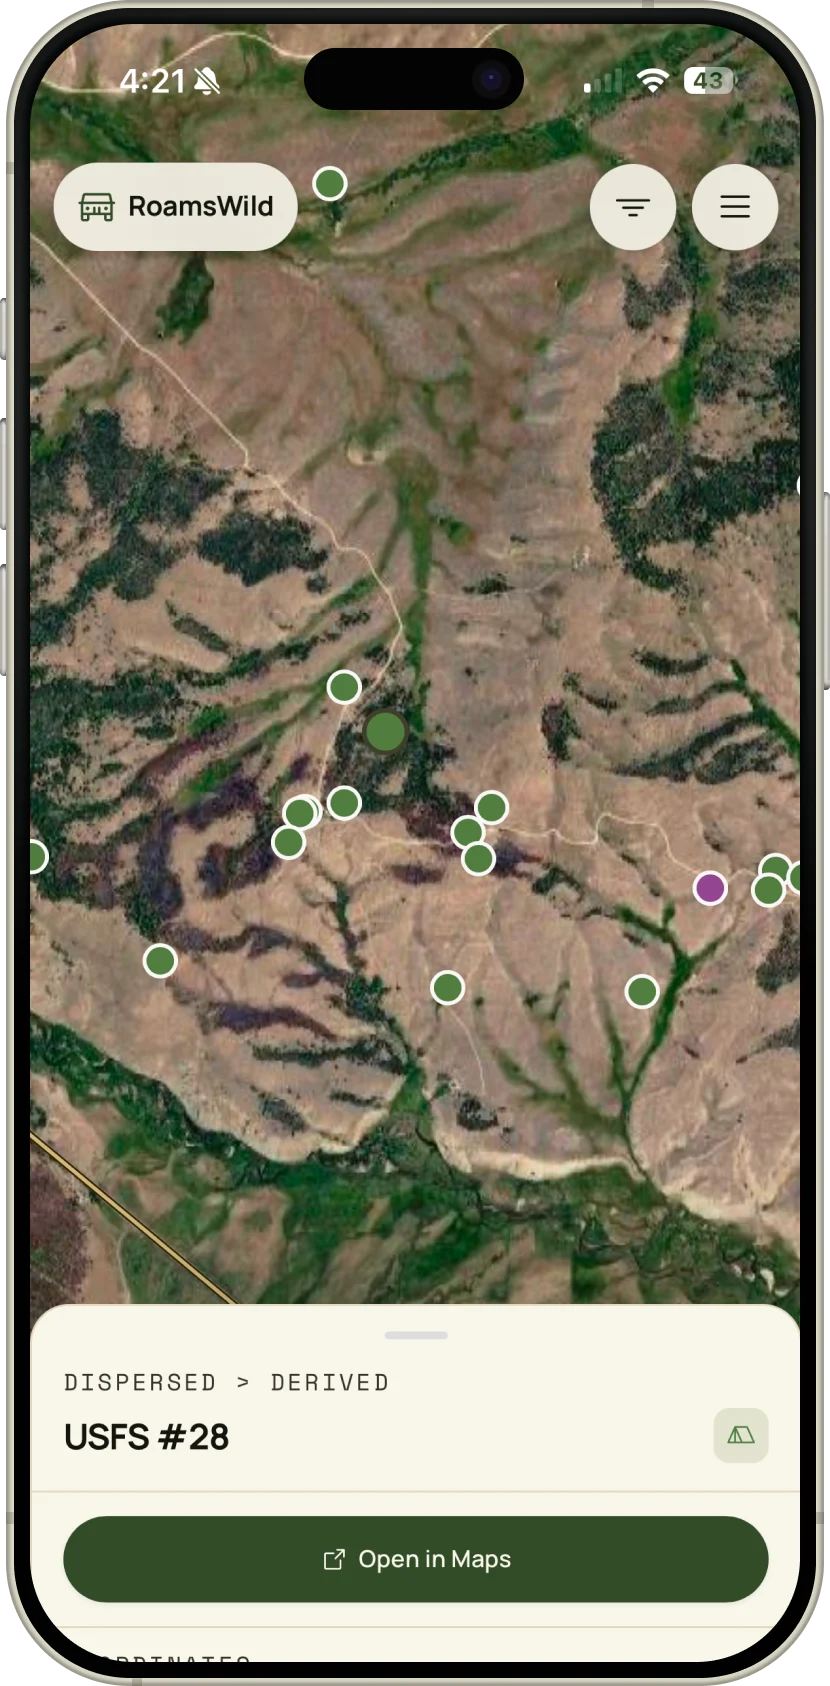
A trip planner for the places GPS forgets
Summary
RoamsWild is a trip planner for road-based travel on US public lands, built solo. It turns scattered government and crowdsourced data into legal, drivable, light-aware itineraries from a soft prompt like '4 days in Southern Utah, no 4WD.'
Results
Shipped a live product wired to over a dozen external services. Cut Photo Scout query time from ~50s to ~150ms with a region-scoped feature cache, and refactored a 2,606-line React monolith into a 218-line page anchored by an AI-assisted workflow.
16
External services
21
Edge Functions
30k+
Dispersed spots
Reducing the merchant account creation process from weeks to minutes
Summary
This new onboarding process changed an unwieldy manual process to a scalable, automated flow so merchants could onboard and install products without the need for internal interference.
Results
We condensed over 40 data inputs that required information from three different user types to the necessary 11 inputs and automated creation of environments so merchants could get set up without requiring manual work by our Implementation Managers.
40 → 11
Data inputs reduced
Minutes
Instead of weeks
0
Manual work required

Doubling Conversion: Abandoned cart redesign with direct-to-checkout links
Summary
A simple redesign of abandoned cart emails that utilized direct to checkout links and a more robust merchant dashboard experience
Results
The new emails resulted in doubling recovery rate for select merchants from and average of 6% to 13%, with some up to 26%, recovering $18M of potentially lost revenue.
6% → 13%*
Recovery rate doubled
$18M
Revenue recovered
26%
Peak recovery rate

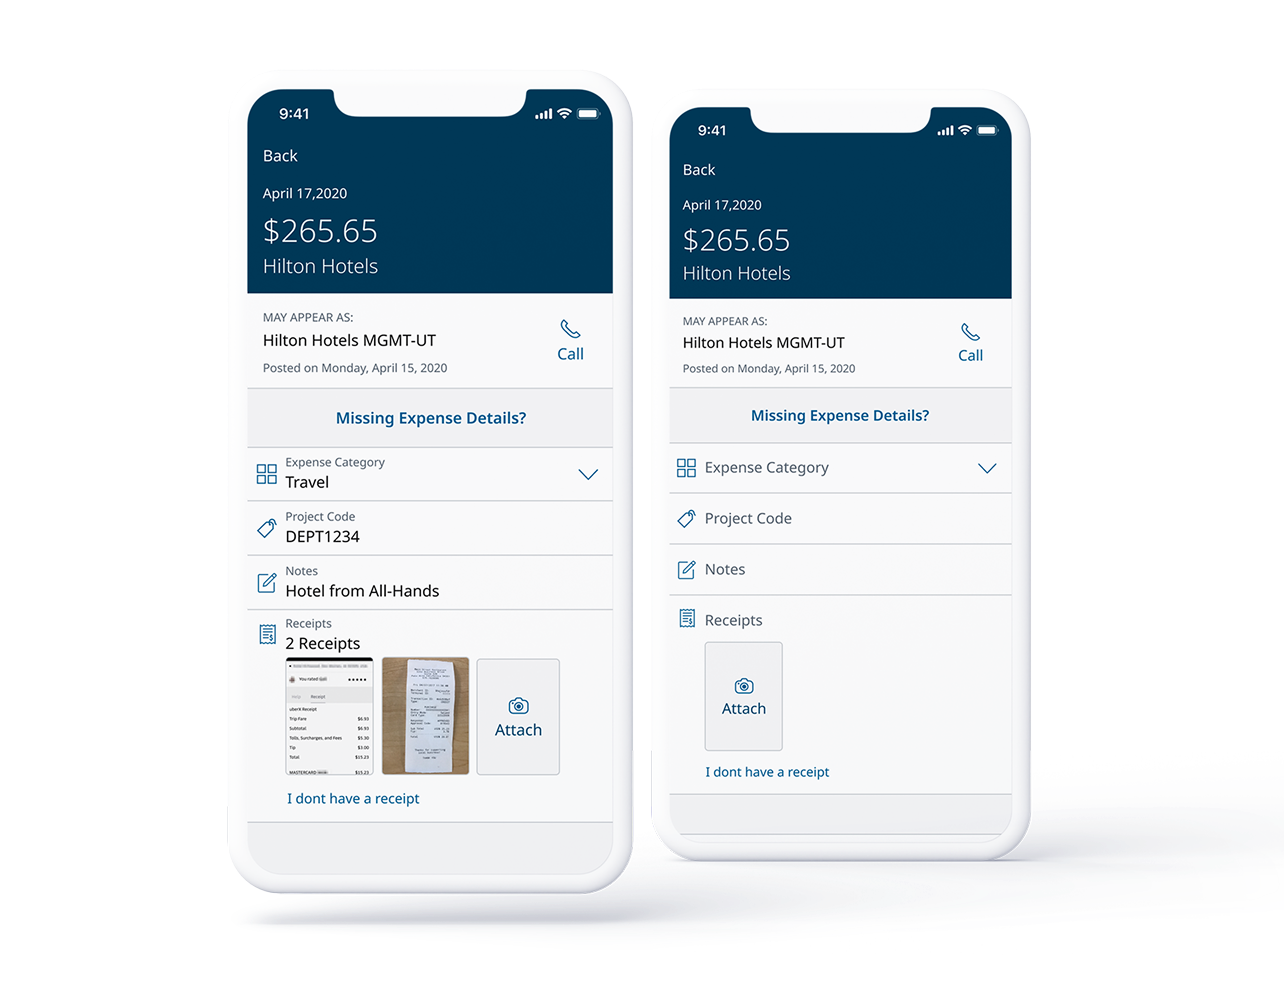
Automating admin workflows and simplifying employee expense reporting
Summary
This created a direct route for cardholders to attach expense information to transactions and have it immediately available to Card Program admins for reconciliation.
Results
Cut out weeks of time from program admin's jobs and increased tax compliance by tying receipts directly to expenses and removing the need to keep and store a massive amount of paper receipts and expense reports.
Weeks
Of manual work cut
0
Paper receipts needed
↑
Tax compliance